OSPR
Interactive Map Viewer is best viewed in Internet Explorer 5.0 or
higher.
LAYER
LIST (highlighted in orange):
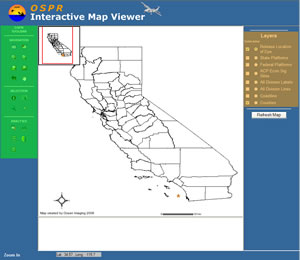
OSPR
Interactive Map Viewer list of GIS data layers are located on the
right hand side of the map viewer. Layers consist of base data (coastline,
counties,etc.) and time-series data pertaining to the oil spill
response.
Layer
visibility
You can customize the look of the map by making layers visible
and invisible. Clicking the check box to the left of each
of the layer's and refreshing the map will make that layer
visible. Un-checking the box will turn off the visibility
of the layer as well.
Activating
A Layer Clicking the radio button to the left of the layer activates
the layer.
This allows you to select attributes of that layer with the
selection toolset.
TOOLBAR
(highlighted in green):
OSPR Interactive Map Viewer toolbar is located on the left hand
side of the map viewer. This section is broken up into three sections:
navigation, selection & analysis.
Navigation
Toggle
Legend - clicking this tool toggles the "Legend View"
& "Layer List"
Overview
map - toggles on and off the overview map located in the upper
left hand corner of the map viewer
Zoom
In - zooms in to the specified area
Zoom
Out - zooms out to the specified area
Zoom
Full - clicking this tool will automatically zoom to the map's
default extent
Zoom
Active - clicking this tool will automatically zoom the map
to the extent of the active layer
Zoom
Back - clicking this tool will automatically zoom the map
back to the previous extent
Pan
- click this tool and move the map in any direction
Selection
Identify
- by selecting this tool and clicking it on an active layer,
an html table will show attribute information, on the bottom
of the map viewer, pertaining to the active layer
Select
Box - allows you to drag a box around shapes from an active
layer and the corresponding attribute information will show
up at the bottom of the map viewer
Select
by line or polygon - allows you to draw a line or polygon
around features you want to select from the active layer
Clear
Selected Features - click this button to clear all selected
features
Analysis
Query
- allows you to query the attributes of the active layer
Measure
- allows you to draw a line to measure distance and segment
distance. Use the set units tool to change units.
Set
Units - allows you to set your display units in feet, meters,
kilometer and miles
Buffer
- allows you to buffer selected points, lines or polygons
selected with the selection tool