
Image Data Acquisition
Satellite Sensors
Ocean Imaging and SeaView Fishing operates our own HRPT AVHRR satellite downlink for AVHRR, as well as acquire and process near-real-time data from the MODIS, VIIRS, Landsat 7, Landsat 8, RapidEye, Sentinel 2A & 2B as well as various altimeters. We provide operational image product support for end-users ranging from researchers and fishing vessels to federal and state agencies. We have expertise in processing and analysis of virtually every type of satellite data including high resolution, visible multispectral, hyperspectral, thermal, Synthetic Aperture Radar (SAR) altimeter. We carefully evaluate the cost-vs-utility of each data option for a particular application to ensure the best results at the lowest cost. Examples of our satellite data processing for a variety of applications are below.
 AVHRR, MODIS & VIIRS: Current Field Detection
Ocean Imaging routinely uses sequential AVHRR, MODIS, VIIRS and even aerial imagery to map ocean currents in near-real-time. Individual thermal or turbidity features are tracked from one image to the next and their displacement over time between images provides the velocity and direction. It is even possible to create interpolated images between each true pair and create current film loops. We also process AVHRR, MODIS and VIIRS data from around the world multiple times per day as part of our SeaView Fishing service.
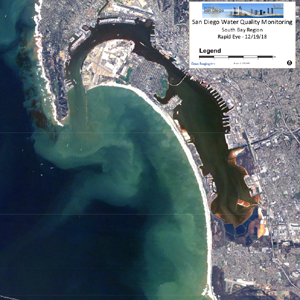 RapidEye:
We utilize RapidEye data on a near-daily basis to monitor and map, waste water outfalls, coastal turbidity, red tides and kelp bed growth. Our technology helped separate the potential effects of the outfall plumes from other sources of polluted runoff nearby and even aided in the settlement of lawsuits related to one of the outfalls. Our image analyses are done in conjunction with traditional field sampling and help interpret the field as well as interpolate them in time and space. The image to the right shows the coastal region of San Diego as seen from the Rapid Eye satellite.
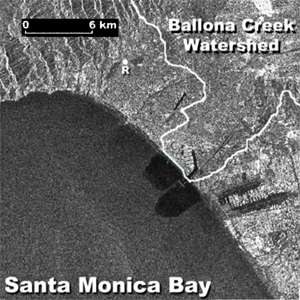 Synthetic Aperature Radar (SAR):
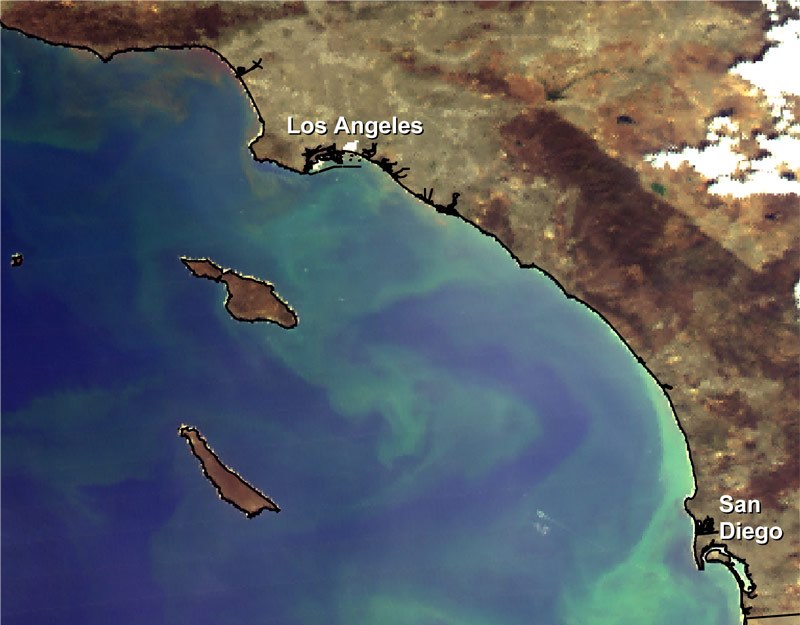
ERS-1 SAR, Santa Monica Bay, California: Coastal runoff in arid regions such as Southern California where rain falls only seasonally tends to exhibit the “First Flush Effect” after the first storms. Such runoff from urbanized areas tends to contain a high concentration of pollutants that have accumulated for months on streets and paved lots, and get finally swept into the ocean. Ocean Imaging used Synthetic Aperture Radar (SAR) imagery to show this effect can be monitored from space. This image shows heavy accumulations of surfactants (dark areas) flowing out of Ballona Creek which flows down through a large part of Los Angeles. In contrast, Malibu Creek to the north which is much less urbanized, does not show the surfactant effects. More details can be found in this publication.
More details can be found in this publication: "Detection of Coastal Urban Stormwater and Sewage Runoff with Synthetic Aperture Radar Satellite Imagery", Eos, Transactions, American Geophysical Union, Vol. 82, No. 50, December 11, 2001, Pages 621, 624-625, 630.
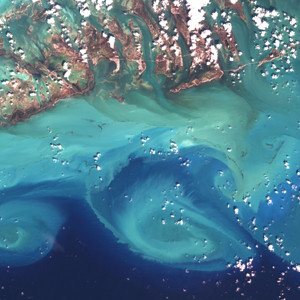 Sentinel 2A, 2B and 3:
We process and analyze Sentinel 2A, 2B and 3 on a daily basis to monitor and map, waste water outfalls, coastal turbidity, red tides and kelp bed growth. We also use Sentinel imagery for scientific research such as the study of the effects of hurricanes on coastal habitats. The Sentinel 2A image to the right shows an area of the Florida Keys through which the eye of the category 4 hurricane Irma passed directly through just 3 days before this image was acquired. Ocean Imaging used such data to assess the destruction and recovery of various types of vegetation during the six months after the hurricane’s passage.
 VIIRS: Chlorophyll
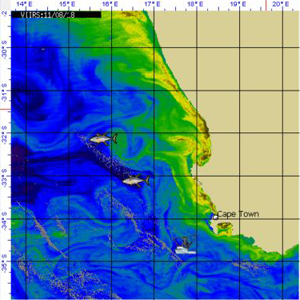
The 750-meter VIIRS image shows plankton (i.e. chlorophyll) distributions off the western coast of South Africa. Blue areas contain blue, clear water while yellow, green and brown areas contain progressively denser plankton blooms and hence greener, murkier water. Plankton blooms off South Africa occur either from westerly currents bringing nutrients into the region from the region south of the cape or due to localized upwelling along the shore. This particular image is one of the SeaView Fishing service products used by fishers to locate high-productivity zones in the open ocean.
WorldView-2:
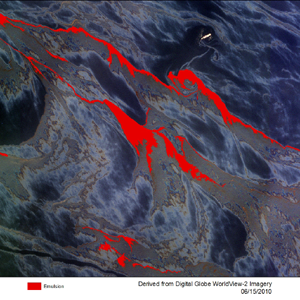
WorldView-2 image subsection acquired during the Deep Water Horizon oil spill. These high-resolution data were used as part of Ocean Imaging’s work on a special committee to help determine the extent and amount of oil on the ocean’s surface resulting from the well blowout. This particular scene shows the emulsified oil classified in red overlaid on the a specially-enhanced version of the satellite data.
 MODIS: Red Tide Plume–San Diego, CA
Red tide blooms affect Southern California beaches almost every year. They are caused by a harmless dinoflagellate plankton organism but when the bloom is intense, the affected waters become very murky and sometimes smelly as the organisms die and degrade. The blooms also cause spectacular nighttime surf-zone phosphorescence displays.